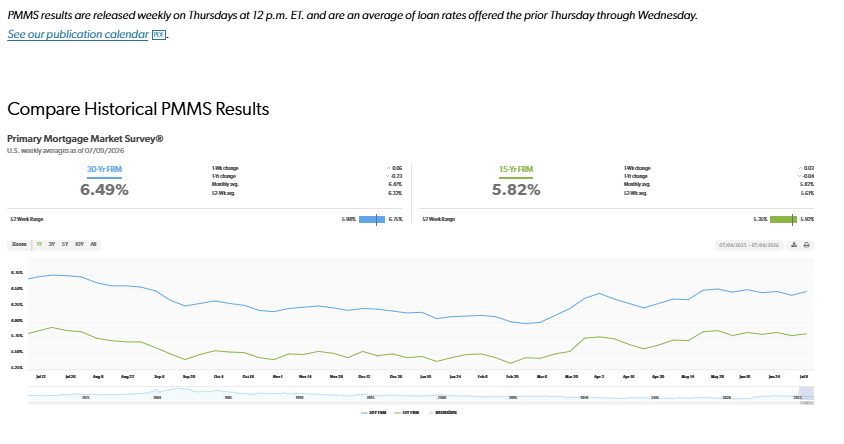
With half of the year behind us for the Phoenix metro area home sales, we’ve seen some interesting changes. It goes without saying, if you have deep pockets, every day interest rate changes don’t effected your buying decisions. For that need financing for home purchases less than $750,000, are more susceptible to interest rate fluctuations.
Interest rates have dropped year over year by ¼ point, but rates dropped to the lowest point in February 2026 to 6%. Imagine buying a home and waiting for rates to drop to lock in the lowest possible mortgage payment possible.
This chart for 2025 vs 2025 interest rates is provided courtesy of FreddieMac.com/pmms
The other change in the Phoenix housing market is the frenzied market is in the rear view mirror. There can still be multiple offers if a home is in great condition, has been remodeled and is priced according to comparable sales. But if a home needs to be remodeled and is under $750,000, it’s best to be aggressive on a list price. It needs to be clean and photographed entirely with the best photos in the first 6 of the listing.
One point to consider is that there is one more business day of selling in July 2026 versus July, 2025. Although this souds minor, it does change totals.
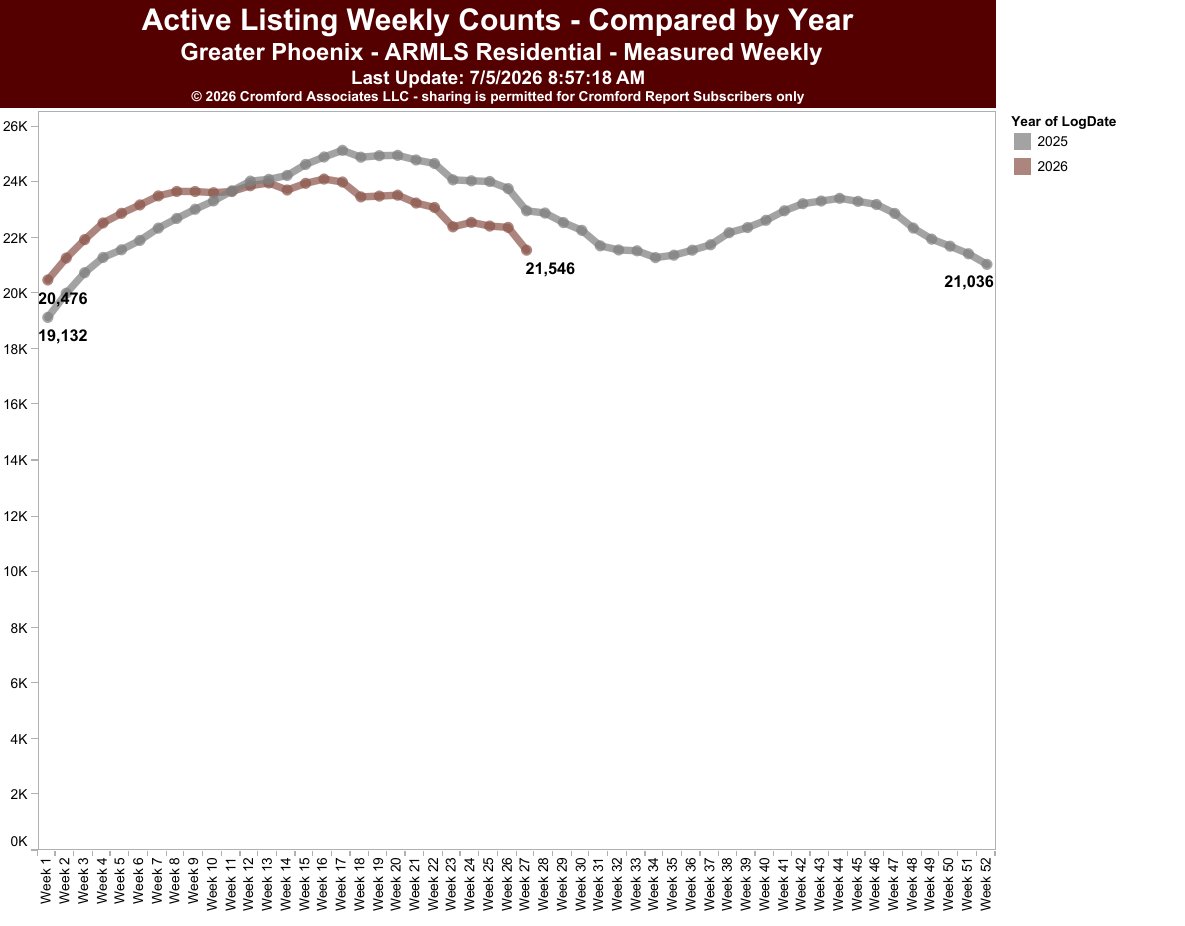
Active listings have dropped 7% year over year. With fewer homes to show to buyers, there is pressure to find the right home. Buyers may be waiting for interest rates to drop. This chart and the following charts are provided by subscription to the Cromford Reports. Please do not copy, but reach out to me if you'd like more information.
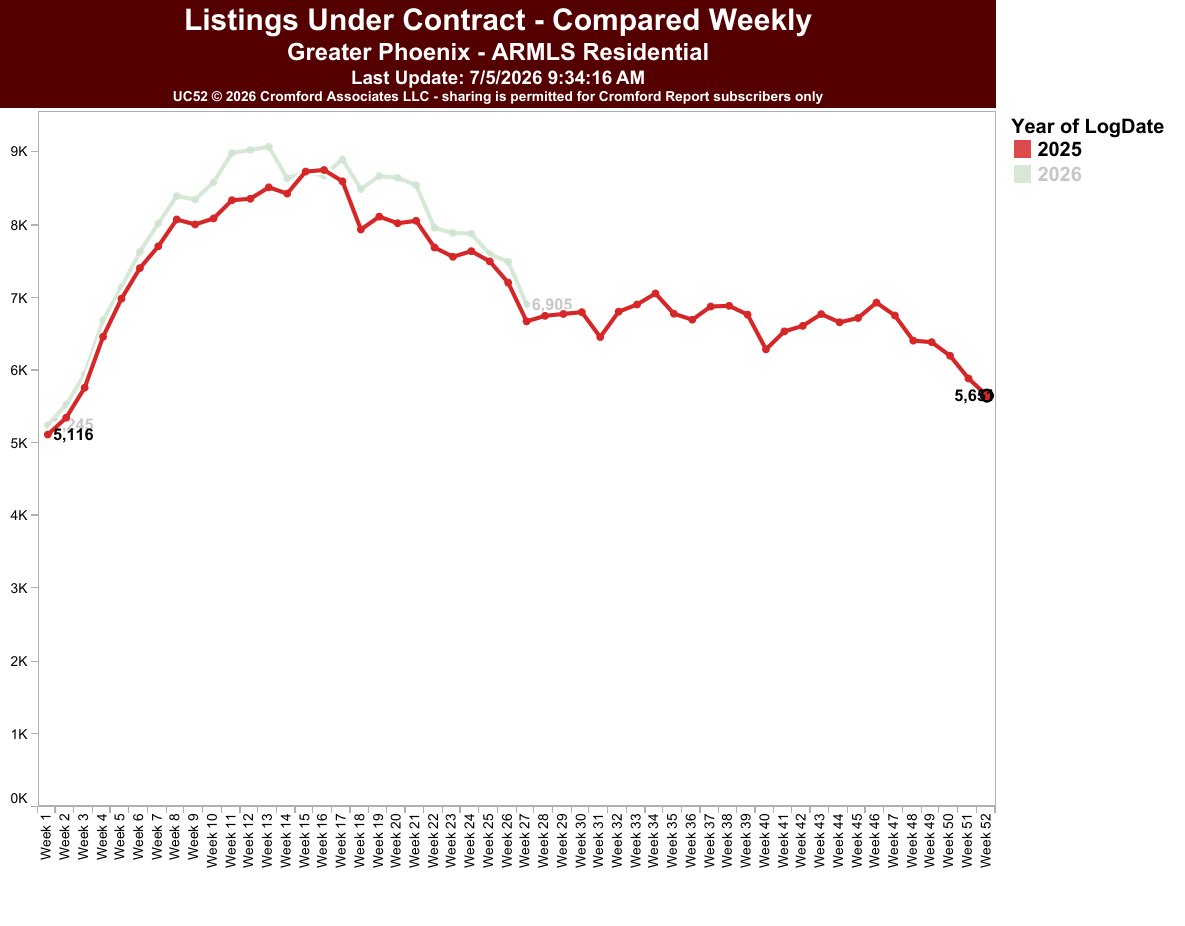
There has been a 4% increase in listings under contract year over year. When interest rates drop, buyers may be coming off the fence to purchase a home. A year ago, there were 6672 listings under contract; for 2026 there are currently 6905 listings under contract!
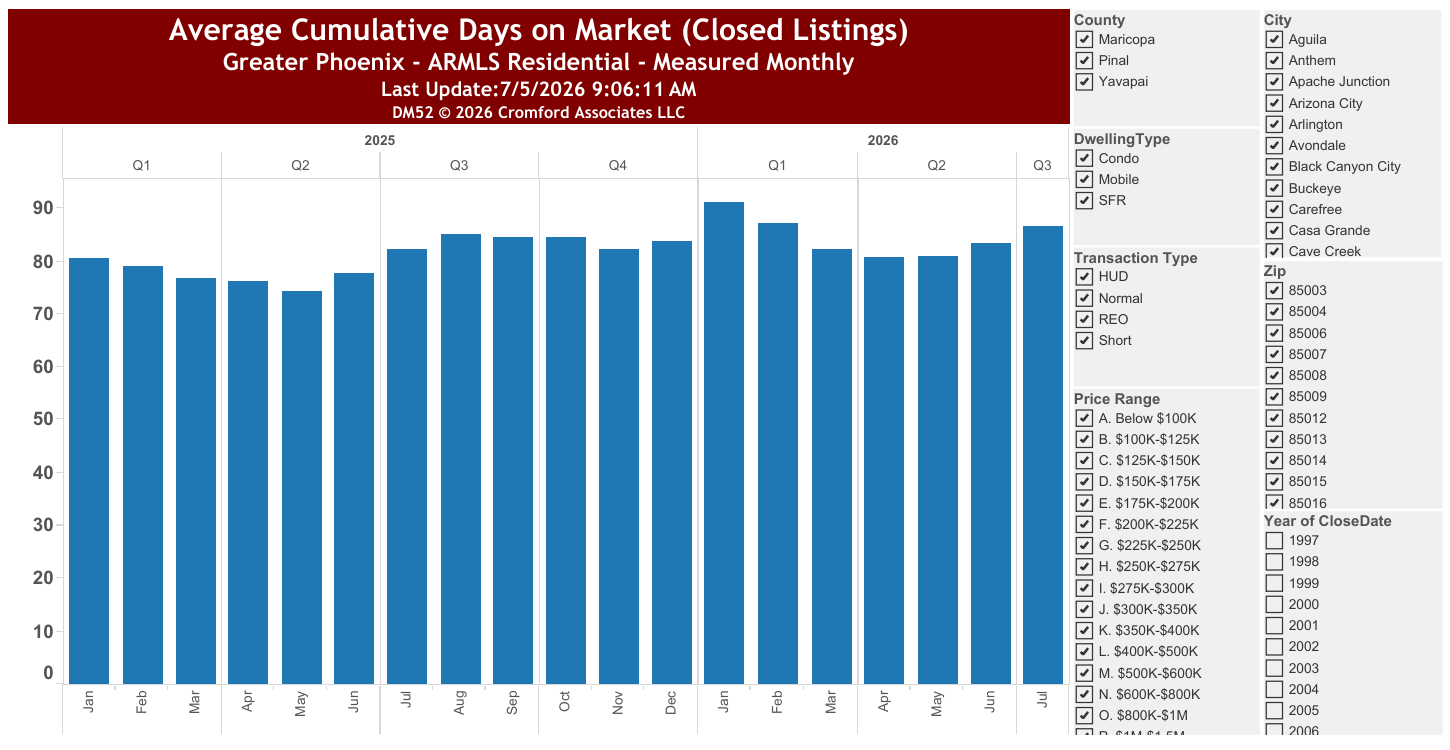
But homes are taking longer to sell. The days on market has increased 5% from 82 days on market to 86 days on market year over year. Not a huge change.
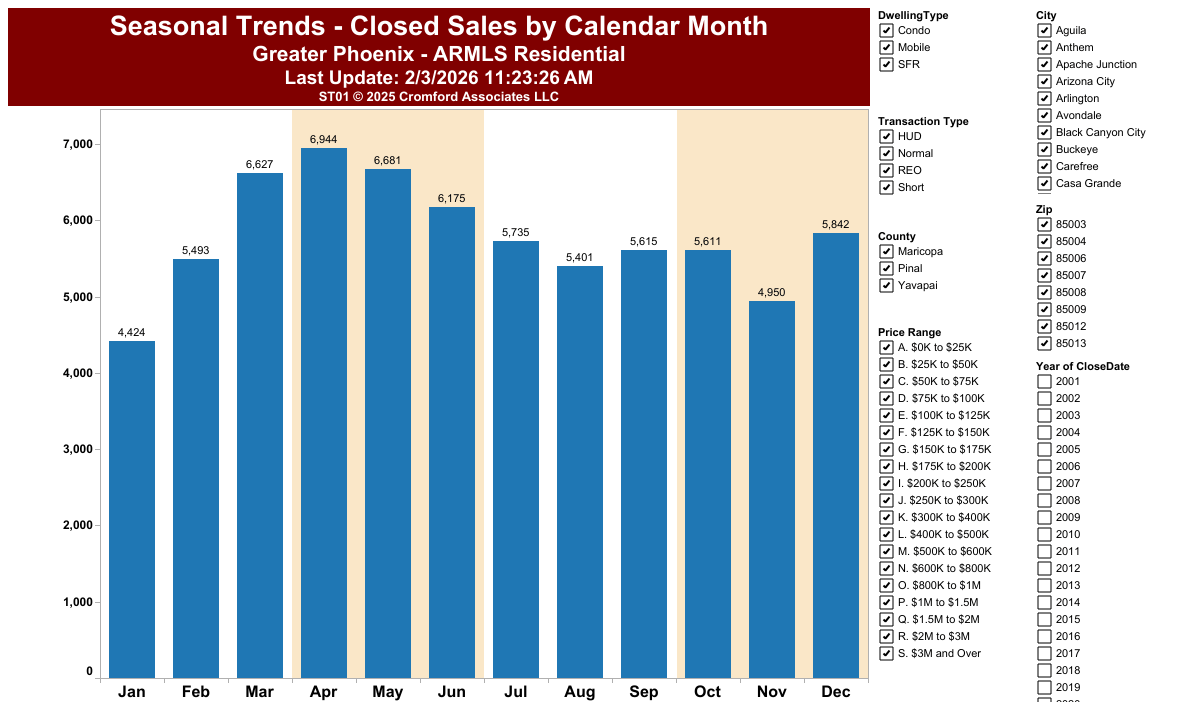
Seasonal trends are back in play now that the frenzied housing market is behind us. These are total sales number for 2025. Fueled by cooler weather showings, sales increase for the months of March to June. July and August experience slower sales as our summer heat encourages full time residents to seek cooler climates in Northern Arizona. But it’s business as usual come September and October. December, 2025 was a busy month as interest rates were lower from October to March. Knowing when most homes sell will help a seller who wants to sell quickly; listing a home during the Holidays will likely extend days on market, unless the home is priced to sell, clean and with improvements.
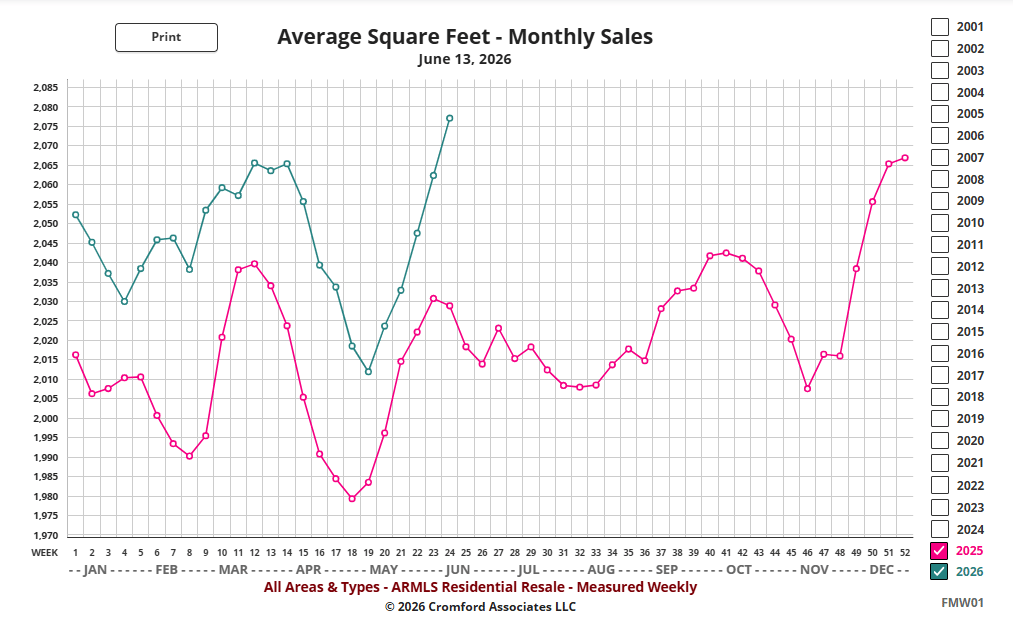
Another interesting statistic is increasing home size for 2026 versus 2025. Notice an increase in the square footage of homes sold in 2026 versus 2025. Buyers may have resigned themselves to buying as much home as they can afford, accepting that a 3% interest rate is not in the cards. Lenders are doing a good job of explaining that an interest rate isn’t permanent – if interest rates drop, they can always refinance. Of course this includes all sales prices. Since luxury sales are spiking thanks to rising performance in the stock markets, larger homes have sold as well.
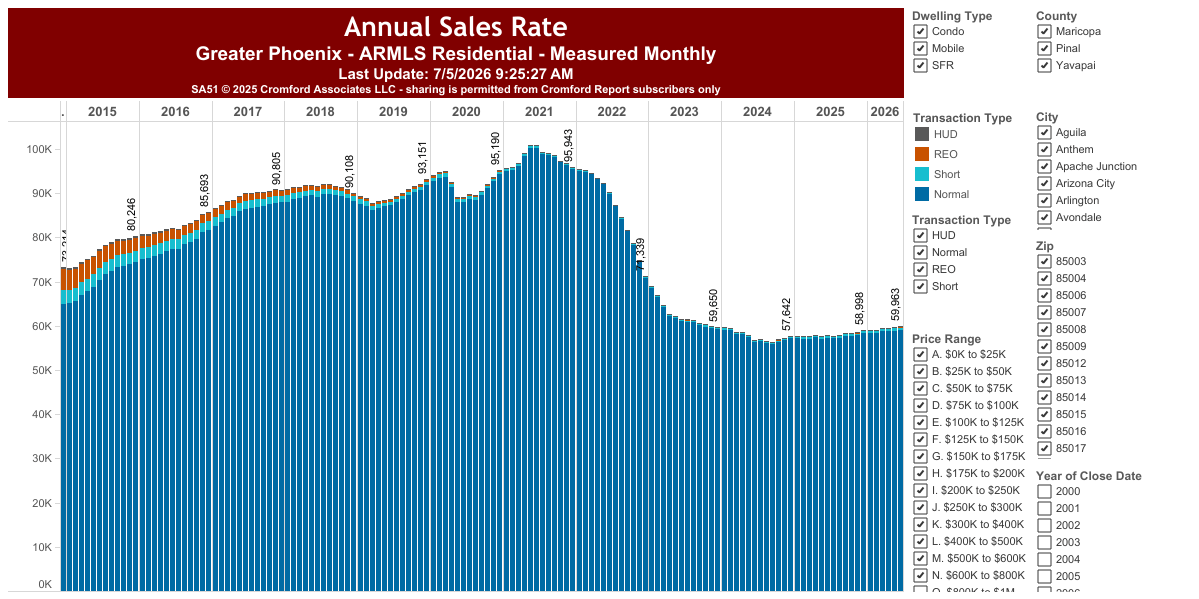
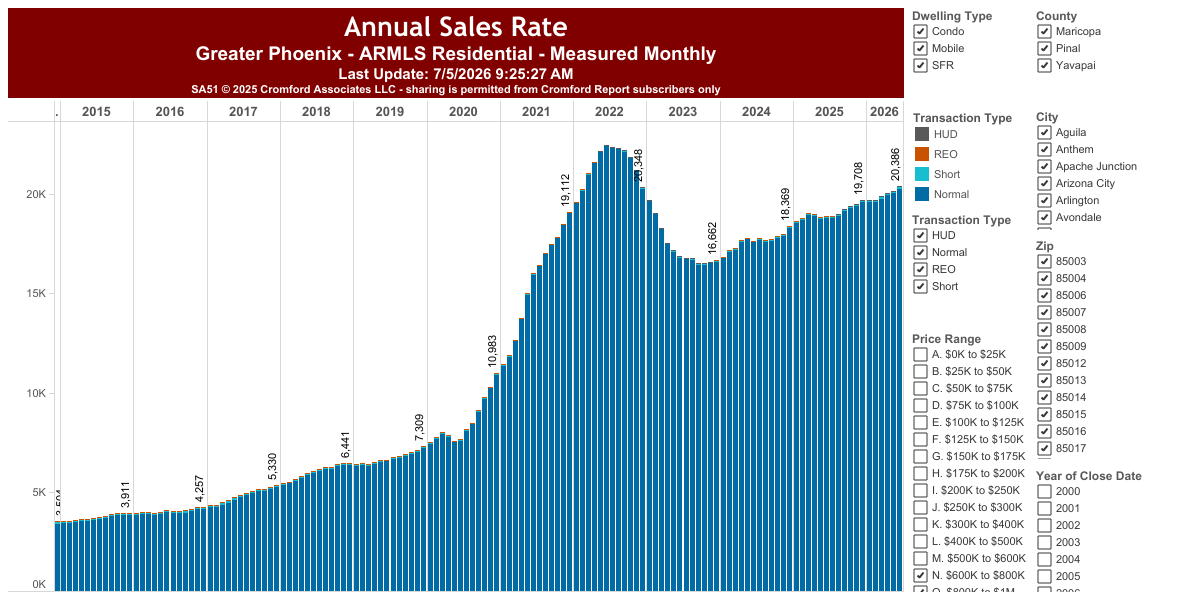
Let’s separate homes under and over $800,000 for home sales. This first chart reflects a slight increase in the number of home sales from 2025 versus 2026 for homes priced less than $800,000. Comparing sales years ago is a real way to show the history of home sales in Maricopa County. Notice practically zero short sales and foreclosures.
Check out this chart reflecting home sales over $800,000 that rose 8% year over year. A very different chart comparing different segments of the market.
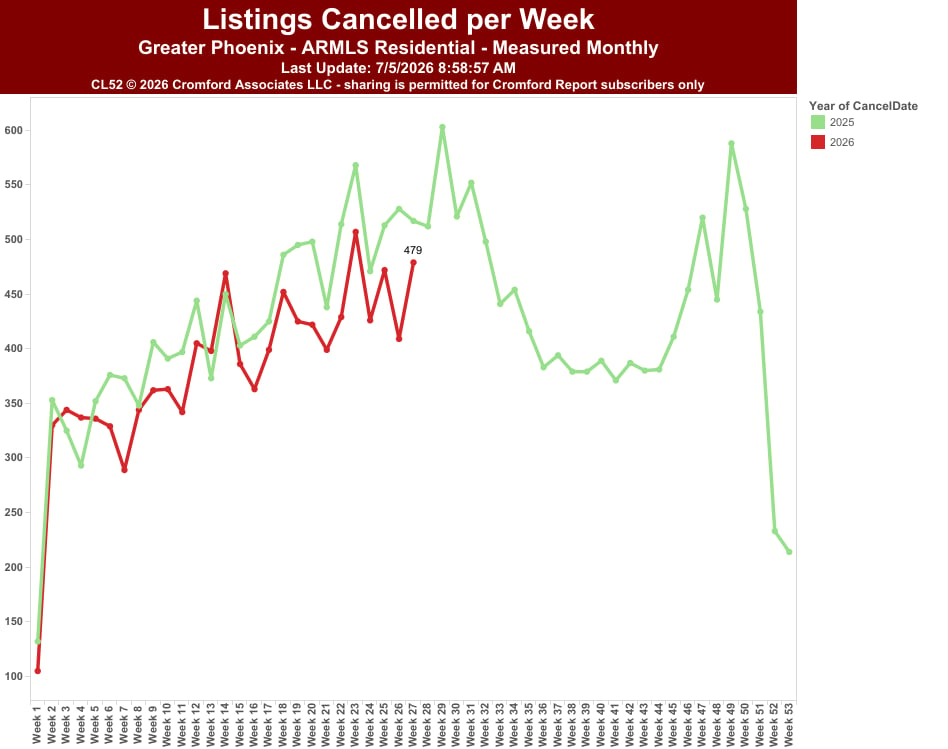
And when sellers don’t sell and get tired of waiting to receive a contract, they cancel after so many days on market. This chart reflects a 7% decline in cancelled listings. Remember that our inventory hovers around 25,000 listings at any given time. Today, there are 24,474 Active listings on the market with 455 more coming soon. So 300 listings that cancel doesn’t have a huge effect on the market. It would affect it more if we had even lower inventory.
If you’re reading this report and have questions, feel free comment! If you would like information about a specific zip code in Maricopa County, comment or reach out to me.
As with all real estate markets, real estate is local so these numbers don’t apply to anyone living outside of Maricopa County, Arizona!